Which States Are Adding Jobs: The August 2026 State Numbers
Published: September 19, 2026 | By LocalJobPage Team
NATIONWIDE — The national unemployment rate has barely moved all summer, which makes it easy to assume nothing is happening. Zoom in one level and that is plainly not true. The Bureau of Labor Statistics released its August 2026 state numbers on Friday, September 18, and they show a job market that is not one market at all.
Eight states and the District of Columbia saw unemployment fall between July and August 2026, 42 states held steady, and only four states added enough payroll jobs in the month for the change to be statistically significant. Over the full year, Texas added more jobs than any other state and the District of Columbia was the only place to lose them.
Need work now? Skip straight to the job links and start searching →
📊 What the August State Numbers Say
All the figures below come from the BLS Local Area Unemployment Statistics and state payroll program, August 2026 reference month, seasonally adjusted, released September 18, 2026. The national unemployment rate was 4.1 percent in August, unchanged from July.
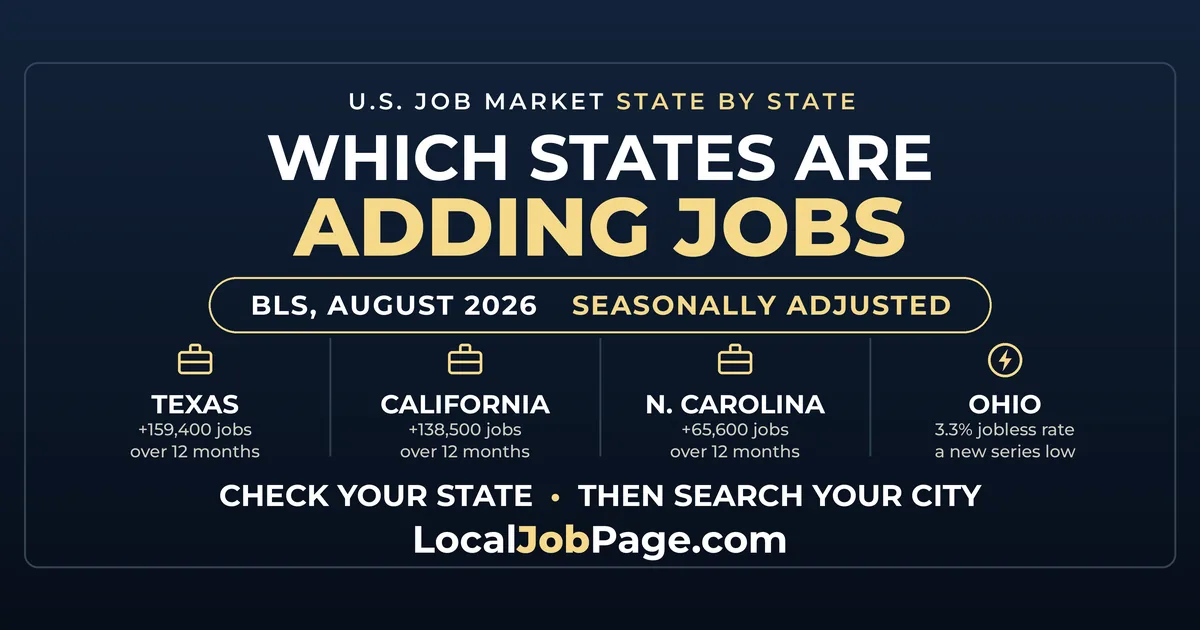
Underneath that flat national line, the spread between states is wide. South Dakota had the lowest unemployment rate in the country at 2.0 percent, with North Dakota next at 2.2 percent. The District of Columbia had the highest at 5.7 percent. Ohio's 3.3 percent was a new series low for the state, in a data series that goes back to 1976.
Month to month, the movement was small and concentrated. Rates fell in Louisiana, Mississippi, Nevada, Pennsylvania and the District of Columbia by 0.2 percentage point each, and in Florida, Maryland, Virginia and Washington by 0.1 point each. No state saw a statistically significant increase. Everywhere else, the rate was effectively where it was in July.
🔥 Where Payrolls Actually Grew
The unemployment rate and the payroll count are two different measurements taken from two different surveys, and they do not always tell the same story. On the payroll side, only four states added jobs in August by an amount large enough to call a real change:
| California | +39,400 jobs (+0.2%) |
| Wisconsin | +11,800 jobs (+0.4%) |
| South Carolina | +10,800 jobs (+0.4%) |
| New Mexico | +5,500 jobs (+0.6%) |
In the other 46 states and the District of Columbia, total nonfarm employment was essentially unchanged over the month. That is a quiet August, not a falling one.
The twelve-month picture is more useful for anyone deciding where to search, because it smooths out a single slow month. From August 2025 to August 2026, the biggest raw gains were:
| Texas | +159,400 jobs |
| California | +138,500 jobs |
| North Carolina | +65,600 jobs |
Raw counts favor big states, so the percentage view matters too. Louisiana, New Mexico and South Carolina each grew payrolls by 1.6 percent over the year, the fastest rate in the country. New Mexico shows up on both lists, which is unusual for a state its size.
The District of Columbia was the only jurisdiction to lose jobs over the year, down 27,000, or 3.6 percent. The release does not attribute that decline to any single cause, and neither will we, but it is the one place in the country where the twelve-month trend is clearly negative.
📉 Where the Rate Moved Most Over the Year
Year-over-year changes in the unemployment rate are measured in percentage points, not percent, and they moved in both directions. The largest declines were in New Jersey, down 1.2 percentage points, and Ohio, down 1.1 points. The largest increases were in Connecticut, up 1.0 point, and Oklahoma, up 0.9 point.
Some others worth knowing: California came down from 5.5 percent a year ago to 5.1 percent, and Pennsylvania from 4.4 to 3.7 percent. Going the other way, Florida rose from 4.0 to 4.5 percent, Arizona from 4.4 to 4.9 percent, and Texas from 4.2 to 4.4 percent even while adding the most jobs in the country. That is not a contradiction: a state can add jobs and still see its rate tick up when its labor force grows faster.
⚠️ What These Numbers Do Not Tell You
A state unemployment rate is an average across an entire state, and almost nobody looks for work at state scale. Ohio's series low does not mean Columbus and a rural county 90 minutes away have the same hiring conditions. The rate also says nothing about which industries are hiring, what they pay, or how long a search takes.
The other limit is statistical. When the BLS calls 42 states stable, it means the measured change was too small to separate from survey noise. A state missing from every list in this release is not a state where nothing happened.
And these are state numbers, not metro numbers. Metro-level August data is scheduled for release on September 30, 2026, and that is the cut that usually matters more for an individual job search.
🔎 Where to Aim Right Now
The state release does not break employment out by industry, so there is no honest way to read sector advice straight out of it. What does travel across every state above: the searches that return real postings are the ones tied to a job title, not to "hiring near me."
Start here:
- Warehouse associate jobs
- Registered nurse jobs
- Medical assistant jobs
- CDL driver jobs
- Electrician jobs
- Manufacturing jobs
- Customer service jobs
- Maintenance technician jobs
- Remote jobs
- Amazon jobs
🗺️ Where to Look in Your City
These are the network cities inside the states this release actually names, plus Washington, D.C., where the twelve-month trend makes a wider search worth starting early.
- Jobs in Houston, TX
- Jobs in Dallas, TX
- Jobs in Los Angeles, CA
- Jobs in San Jose, CA
- Jobs in Charlotte, NC
- Jobs in Raleigh, NC
- Jobs in Milwaukee, WI
- Jobs in Albuquerque, NM
- Jobs in Columbus, OH
- Jobs in Philadelphia, PA
- Jobs in Las Vegas, NV
- Jobs in Washington, DC
Not on the list? Find your city.
Frequently Asked Questions
Which state added the most jobs over the past year?
Texas, with 159,400 more nonfarm payroll jobs in August 2026 than in August 2025, seasonally adjusted. California was second at 138,500 and North Carolina third at 65,600.
Which state has the lowest unemployment rate right now?
South Dakota, at 2.0 percent in August 2026, followed by North Dakota at 2.2 percent. The District of Columbia had the highest rate at 5.7 percent.
Does a low state unemployment rate mean it is easy to find a job there?
Not on its own. A low rate means few people who are looking are currently unemployed, which often also means a smaller state economy with fewer total openings. Pair the rate with the payroll growth figures and, better still, with the metro-level data for the specific city you are searching.
Why did only four states show payroll gains in August?
Because those were the only four where the measured change was large enough to be statistically significant. Most states saw small movements that the survey cannot separate from sampling noise, which the BLS reports as essentially unchanged rather than as zero.
Should I move to a state with a stronger job market?
A twelve-month payroll trend is a weak basis for a move on its own. Housing cost, the wage floor where you would actually be working, and whether your occupation is licensed in that state all matter more. Search the city directly and look at real postings and real pay first.
When do the next state numbers come out?
The BLS is scheduled to publish September 2026 state employment and unemployment data on Tuesday, October 20, 2026, at 10:00 a.m. ET. Metro-level August figures are scheduled for September 30, 2026.
🧭 What to Do With This Week's Numbers
The takeaway is narrow and useful: a flat national rate is hiding real differences, and your state is probably not the average. Save the searches that match your job title and let new postings come to you.
Create a free job seeker account to save searches and apply faster, or browse every open job on LocalJobPage.
Employers: if you are hiring in a state where the rate just fell, your candidate pool got smaller this month. Post a job on LocalJobPage or see pricing.
Related Reading
- August 2026 Jobs Report: Where the 162,000 New Jobs Actually Are
- 7.3 Million Job Openings: What July's Numbers Mean for Your Search
- Where the Jobs Will Be by 2035: BLS Projects 5.9 Million New Ones
- Florida Minimum Wage Hits $15 on September 30, 2026
One month of state data is a snapshot, not a verdict. The useful habit is to check where your own state sits each month, then do the actual searching at the city level, where the openings are.